You can follow along here:
Or follow along here:
Sentiment Analysis Overview
This article will walk you through how to use the Sentiment Analysis report within the Email Vault platform.
Creation Date: July 23, 2025. Created By: Muzammil Hasan. View most recent version on Tango.us
#1 – Page Overview
The Sentiment Analysis page provides a high-level summary of your organization’s email sentiment over a selected time frame. It helps teams understand communication tone across inbound, outbound, and internal email flows.
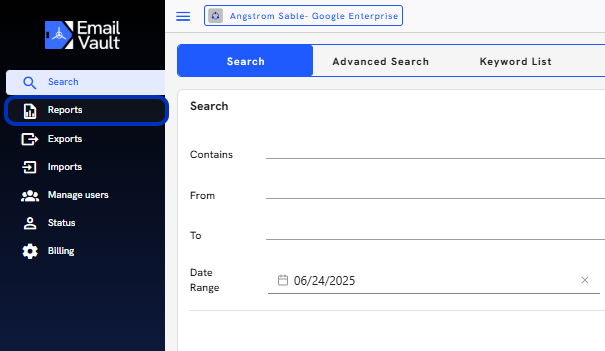
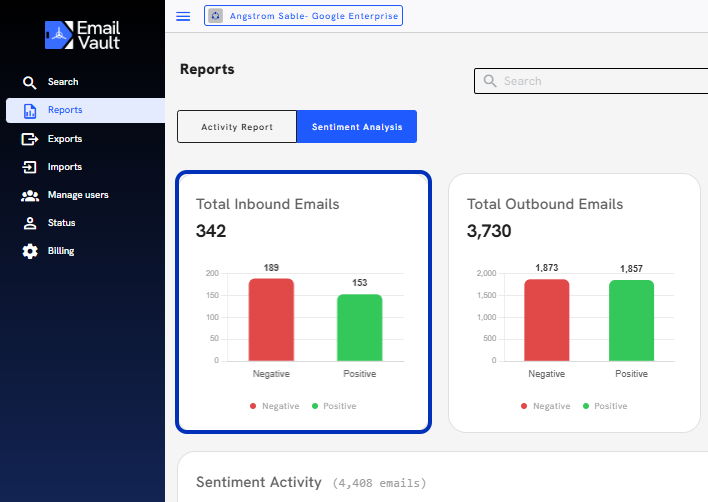
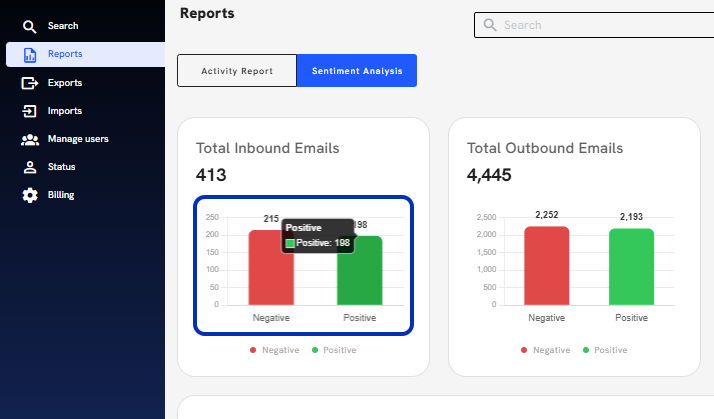
1. Click on Reports
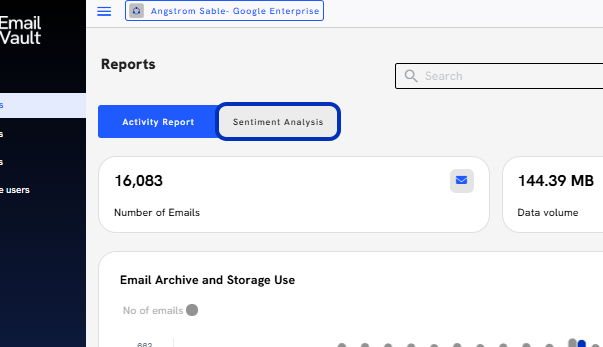
2. Click on Sentiment Analysis tab.
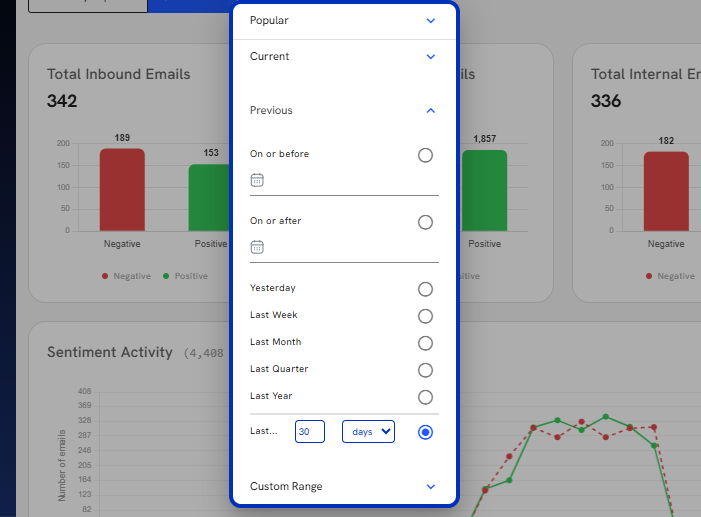
3. Select the time frame. Click on the Last 30 Days dropdown to select your desired reporting period.
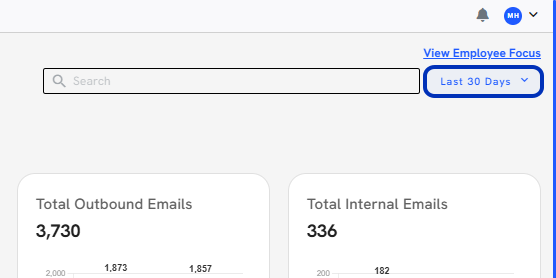
4. A modal window will appear to confirm or modify the time range for sentiment data analysis.
5. Total Inbound Emails: Count of inbound messages with sentiment classified as Positive, Negative.
6. Total Outbound Emails: Sentiment classification for outbound messages your team has sent.
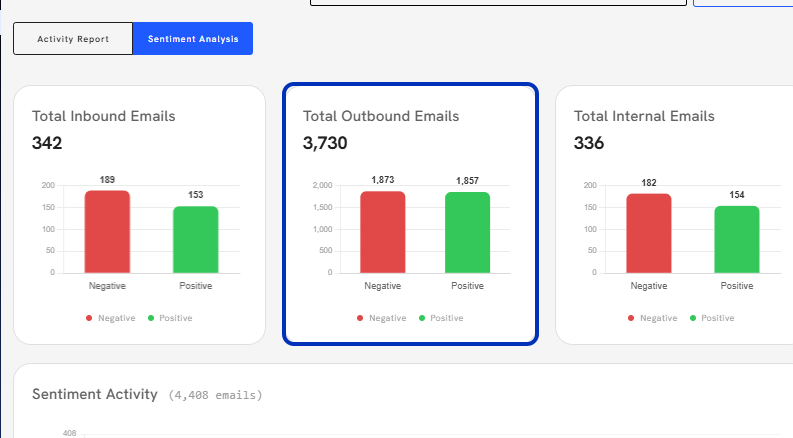
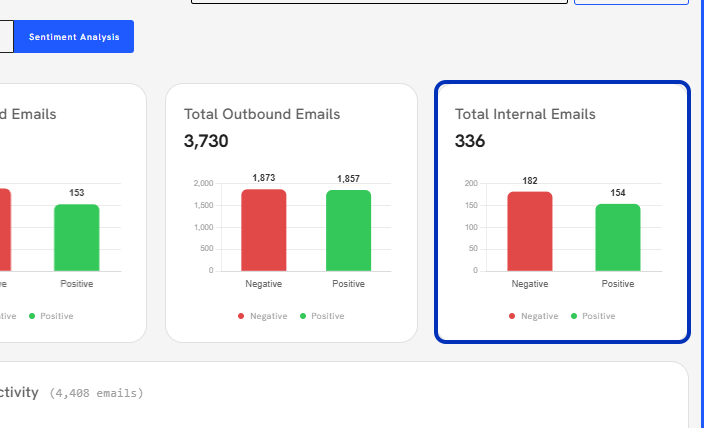
7. Total Internal Emails: Breakdown of sentiment for messages exchanged within your own domain (internal users).
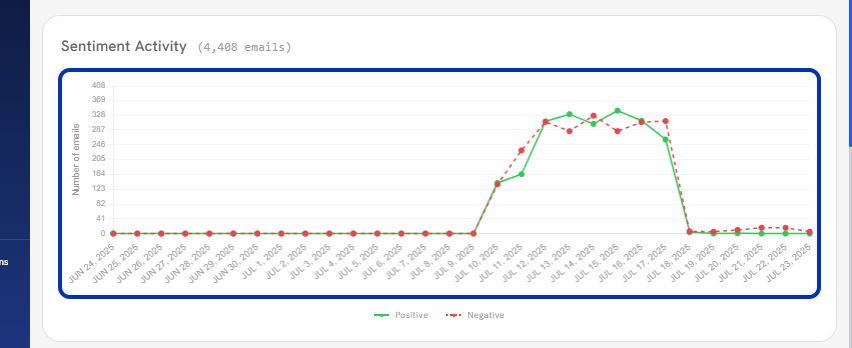
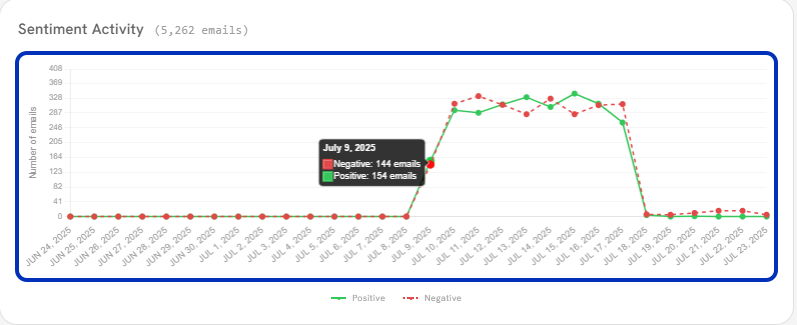
8. Sentiment Activity Graph: A line graph displaying day-by-day trends of Positive and Negative emails—useful for identifying spikes in sentiment shifts.
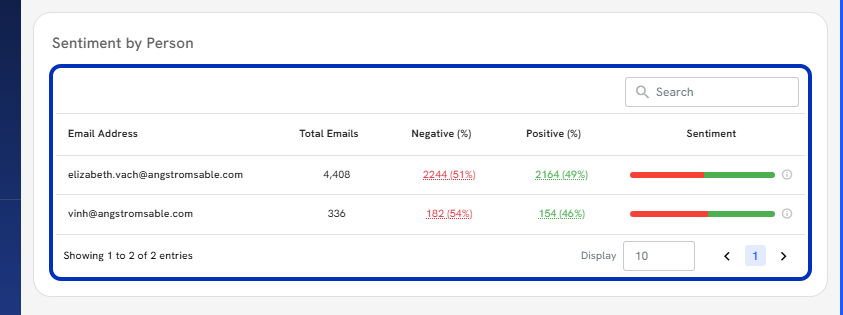
9. Sentiment by Person: A horizontal bar chart showing the volume and sentiment distribution by sender/recipient. Clickable bars allow deep analysis per person.
#2 – Filtering by User or Domain
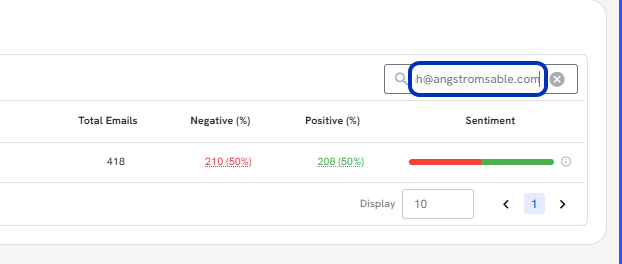
To analyze communication tone for a specific user or domain, use the filter input field located in the top-right corner and on the Sentiment by Person section.
How to Filter:
1. Click on the Search and Enter an email address or domain.
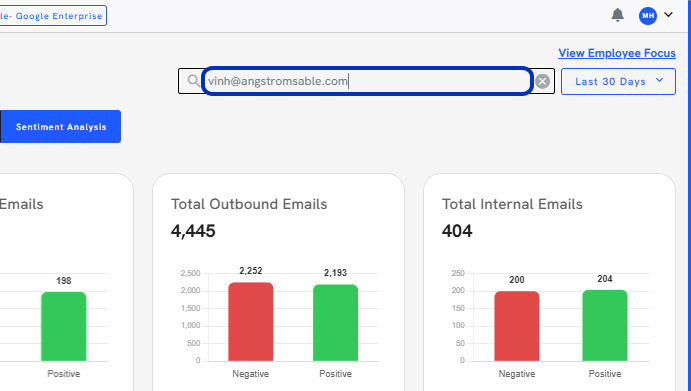
2. This will instantly narrow the graph results and sentiment breakdown to only show metrics for the selected user or organization.
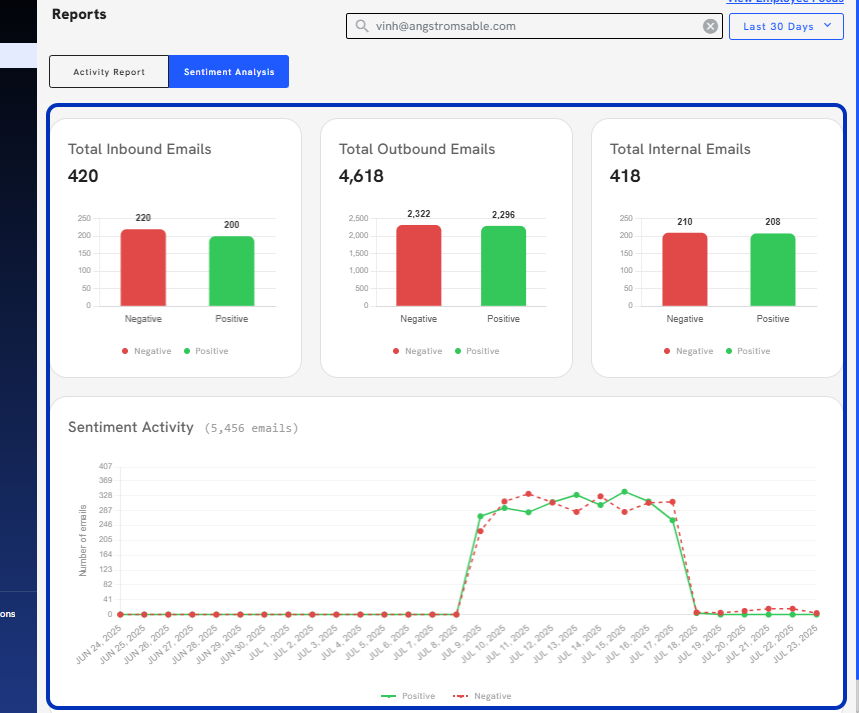
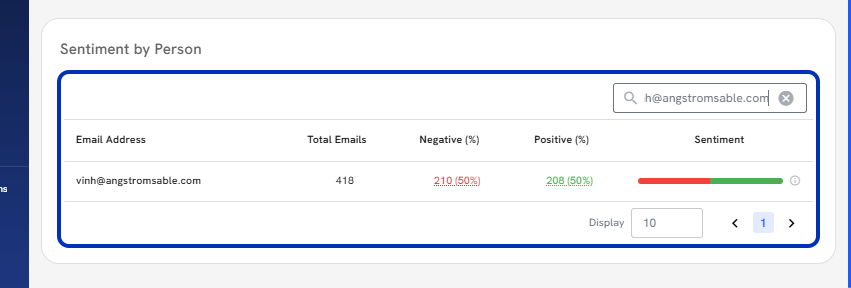
3. Go to Sentiment by Person section and click on the Search bar.
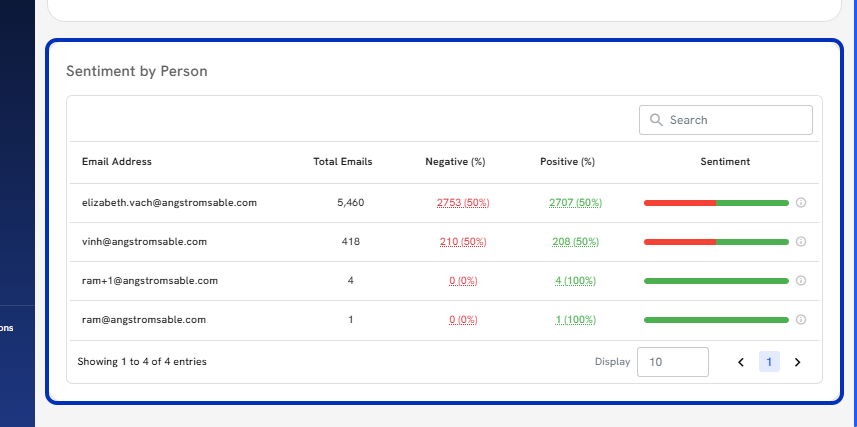
4. Enter the email address in the search field.
5. View the Sentiment by Person result. You will see a breakdown of sentiment percentages and totals.
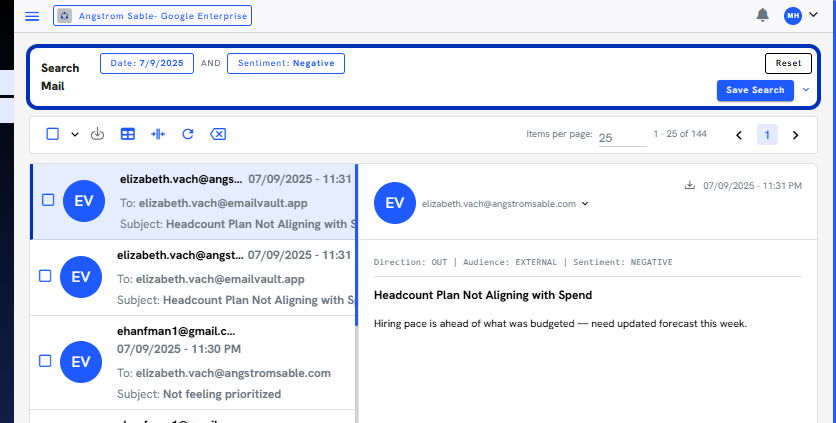
#3 – Clickable Graphs → Search Page
One of the most powerful features of the Sentiment Analysis dashboard is its click-to-drill functionality. This lets you jump directly into filtered email-level data from any graph.
1. Click on a colored sentiment bar (e.g., green for Positive, red for Negative).
2. Or, click a point in the Sentiment Activity graph timeline.
3. The system will automatically redirect you to the Search Mail interface. All filters will be pre-applied: date, sentiment type, direction, and user.