You can follow along here:
Or follow along here:
An Overview of the Reporting Page
This article will cover how to use the reports on the reporting page.
Creation Date: May 21, 2024 Created By: Elizabeth Hanfman View most recent version on Tango.us
# Email Vault
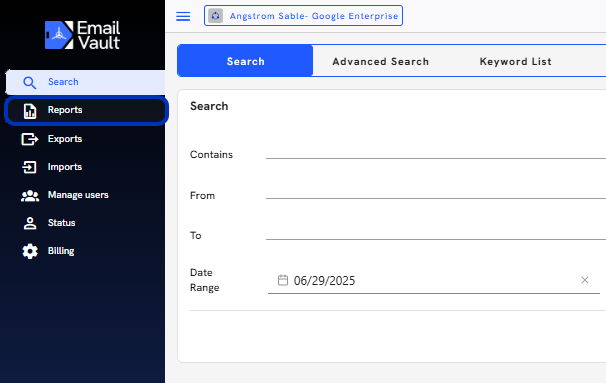
1. Click on Reports
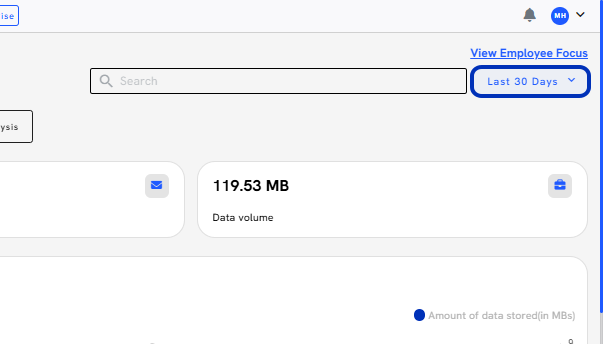
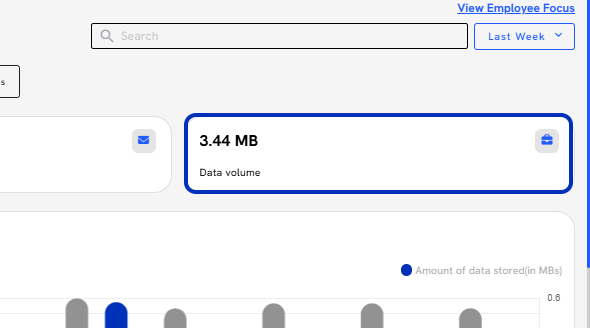
2. Select the time frame you wish to view.
3. Click on Previous…
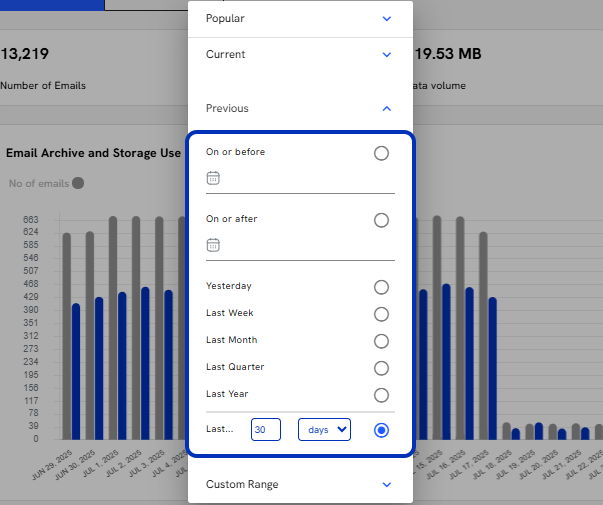
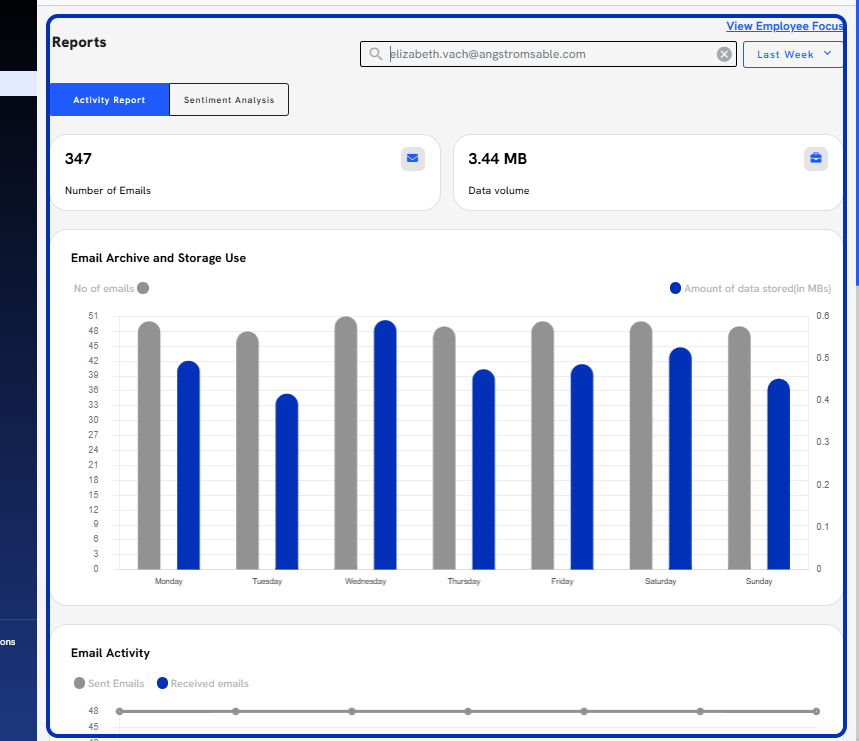
4. These modules will display the data based on the time frame.
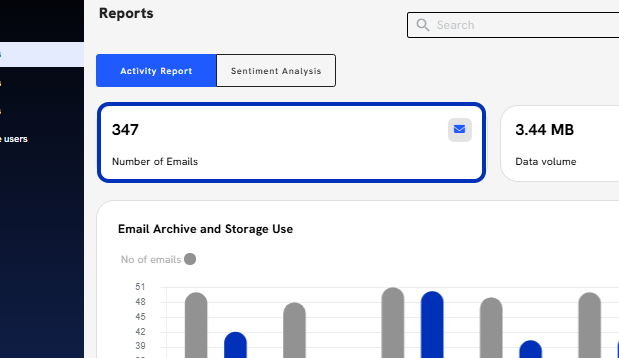
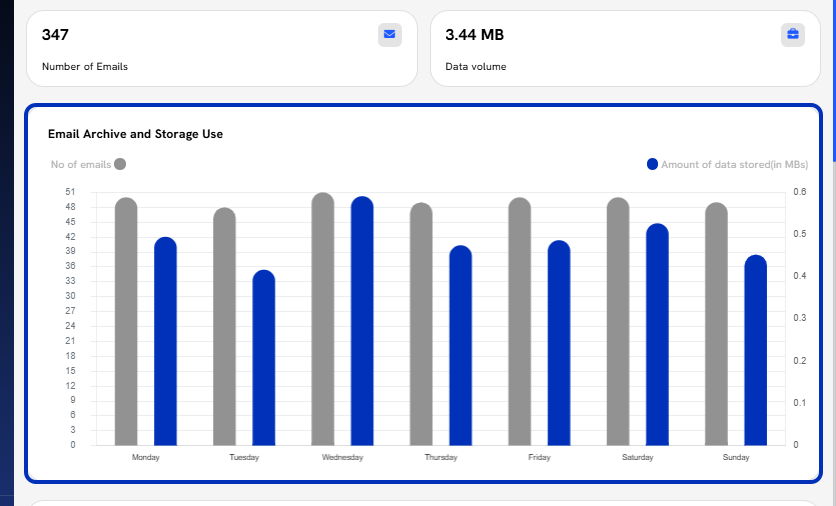
5. Total Data Volume
6. Number of Emails and Storage used by day, week, month, and year.
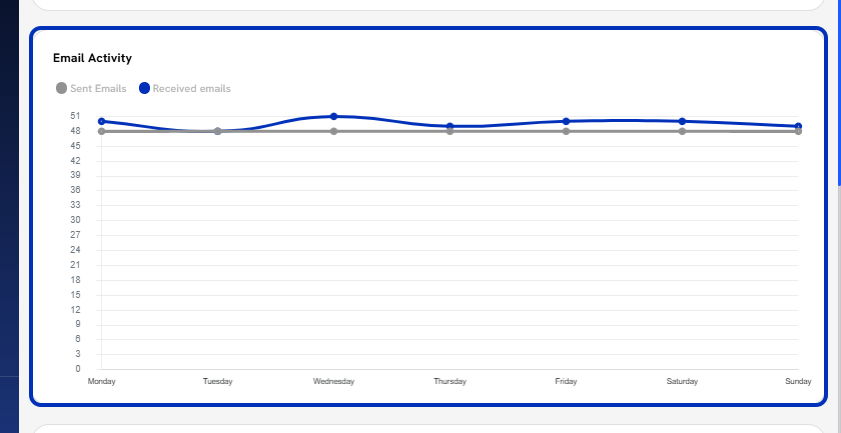
7. Volume of Sent and Received emails
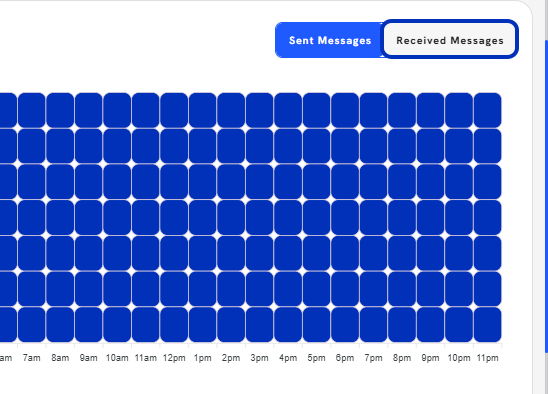
8. A Heatmap of Sent Messages by hour and day
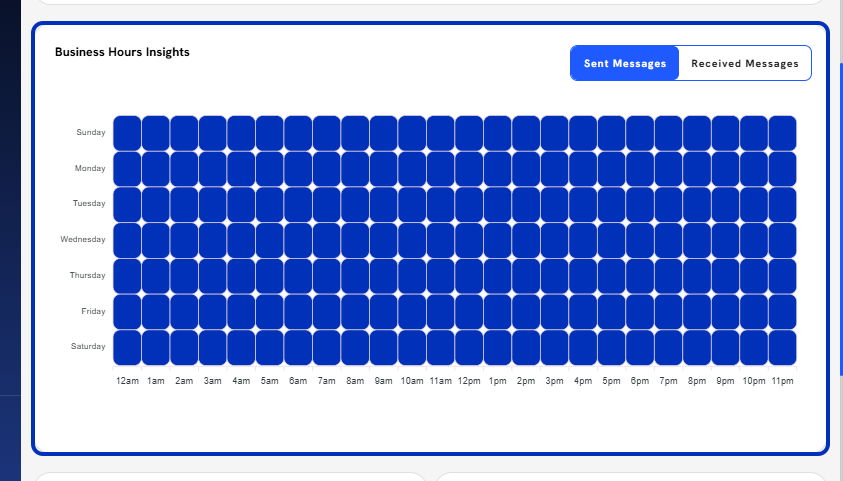
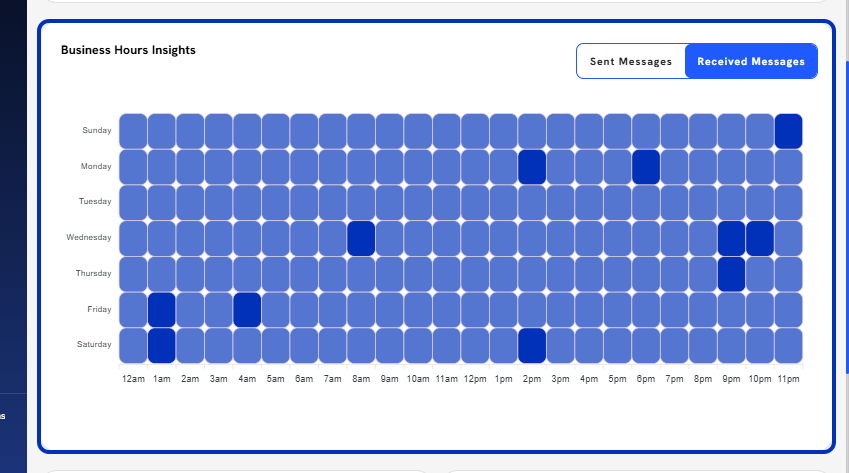
9. Click on Received Messages
10. A Heatmap of Received Messages by hour and day
11. Top Received-From Addresses
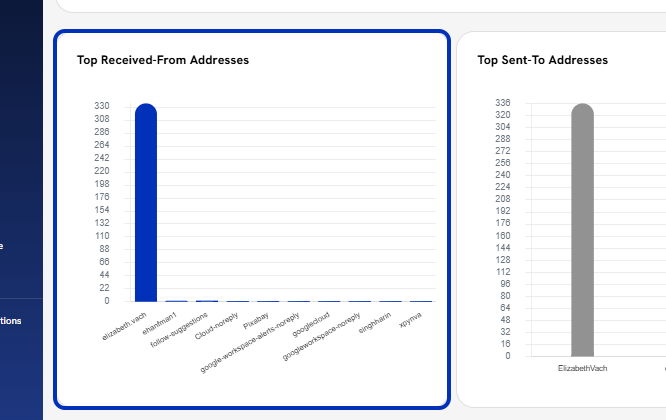
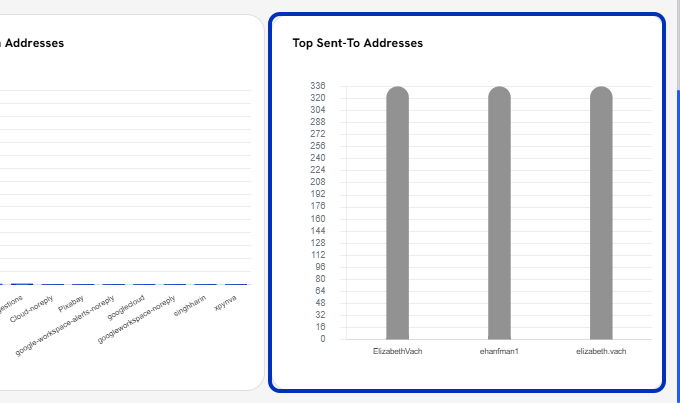
12. Top Sent-To Addresses
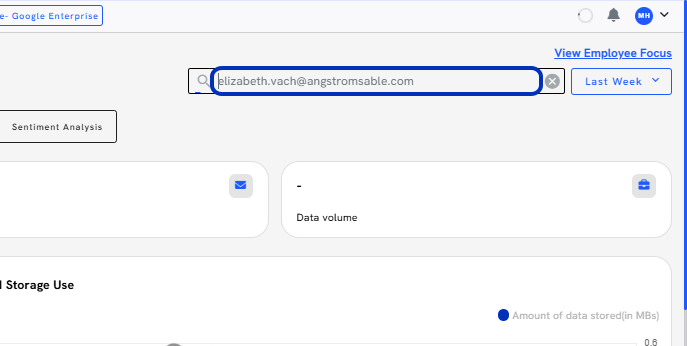
13. In addition to adjusting the graphs by date, you can also display the reports for a specific date or email address.
The default view for the reports is based on the entire organization.
14. The graphs will update automatically.
 Created with Tango.us